


Interactive: wastewater analysis and drugs
Description
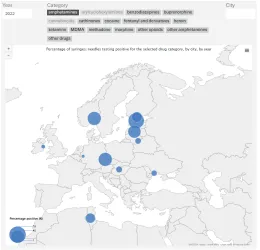
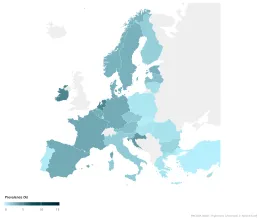
This tool allows the user to explore the data in a Europe-wide study including over 70 cities revealed a picture of distinct geographical and temporal patterns of drug use across European cities. There are two ways to visualise the data from this study, either viewing the data on a map or using a specially-developed charting tool. It is possible to access data from previous studies and examine temporal trends.